
A works manager asks us to look at a manual line. More often than not, a spreadsheet arrives before we do. It holds an operator count, an hourly rate, a capital figure somebody typed into the middle cell, and a payback period quoted to two decimal places. The payback is wrong, and usually not by a little, because the sheet is only costing one side of the decision.
The manual line is not the free option. It has a running cost, that cost repeats every year, and nobody writes it down because nothing about it looks like a purchase.
We have built a calculator that puts both sides on the same axes. It's at roi.jp-engineers.com, it takes about two minutes, and it is free.
The baseline nobody writes down
Ask what a manual line costs to run and you will get a shrug, because the money leaves in fragments. Wages go out through payroll. Scrap goes out through the material account, or gets written off against a yield figure that has been the same for six years. Neither shows up as a line item called "the cost of not automating this".
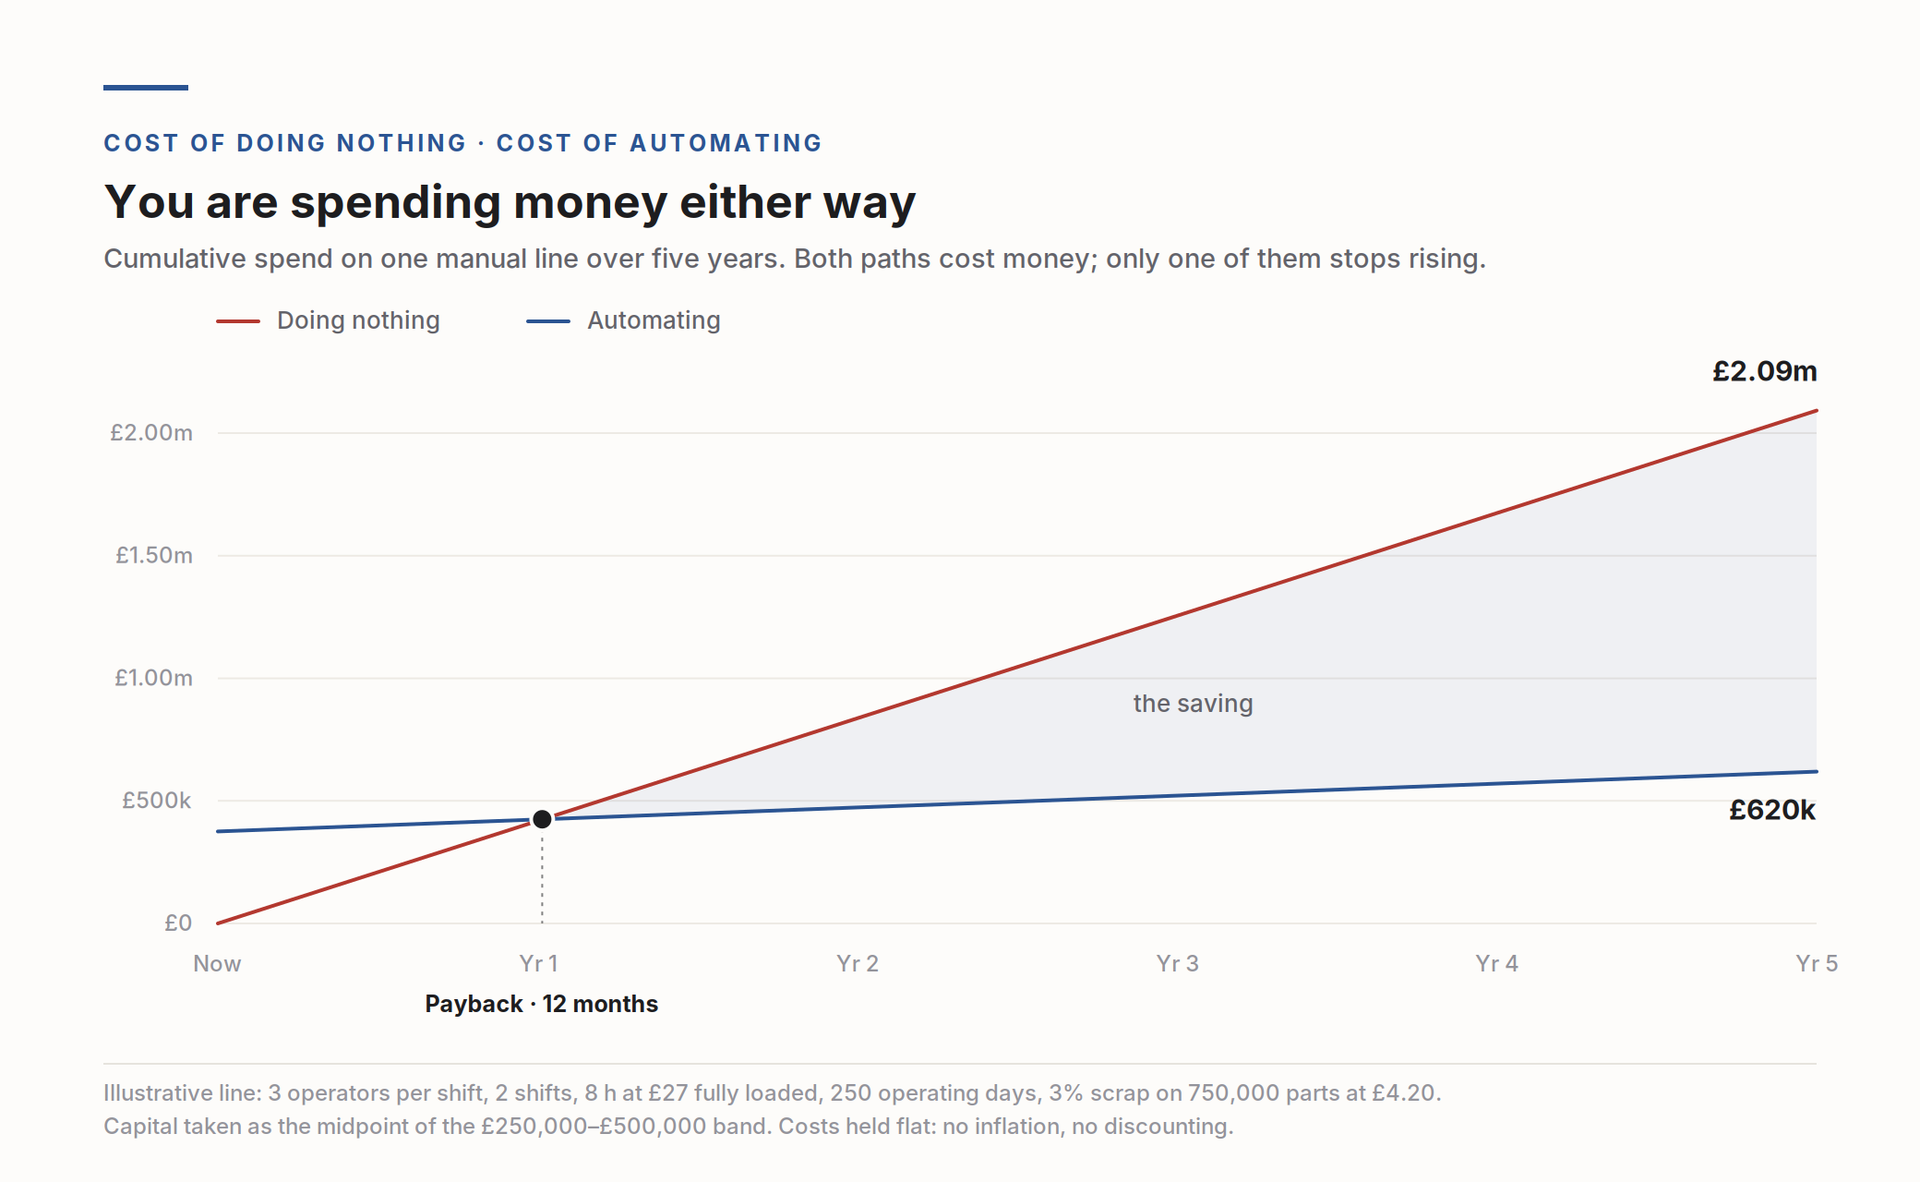
So the calculator builds that figure first, from the labour and production numbers, and shows it before you have entered a capital cost at all. Then it runs the cumulative total out to five years next to the same total for the automated case.
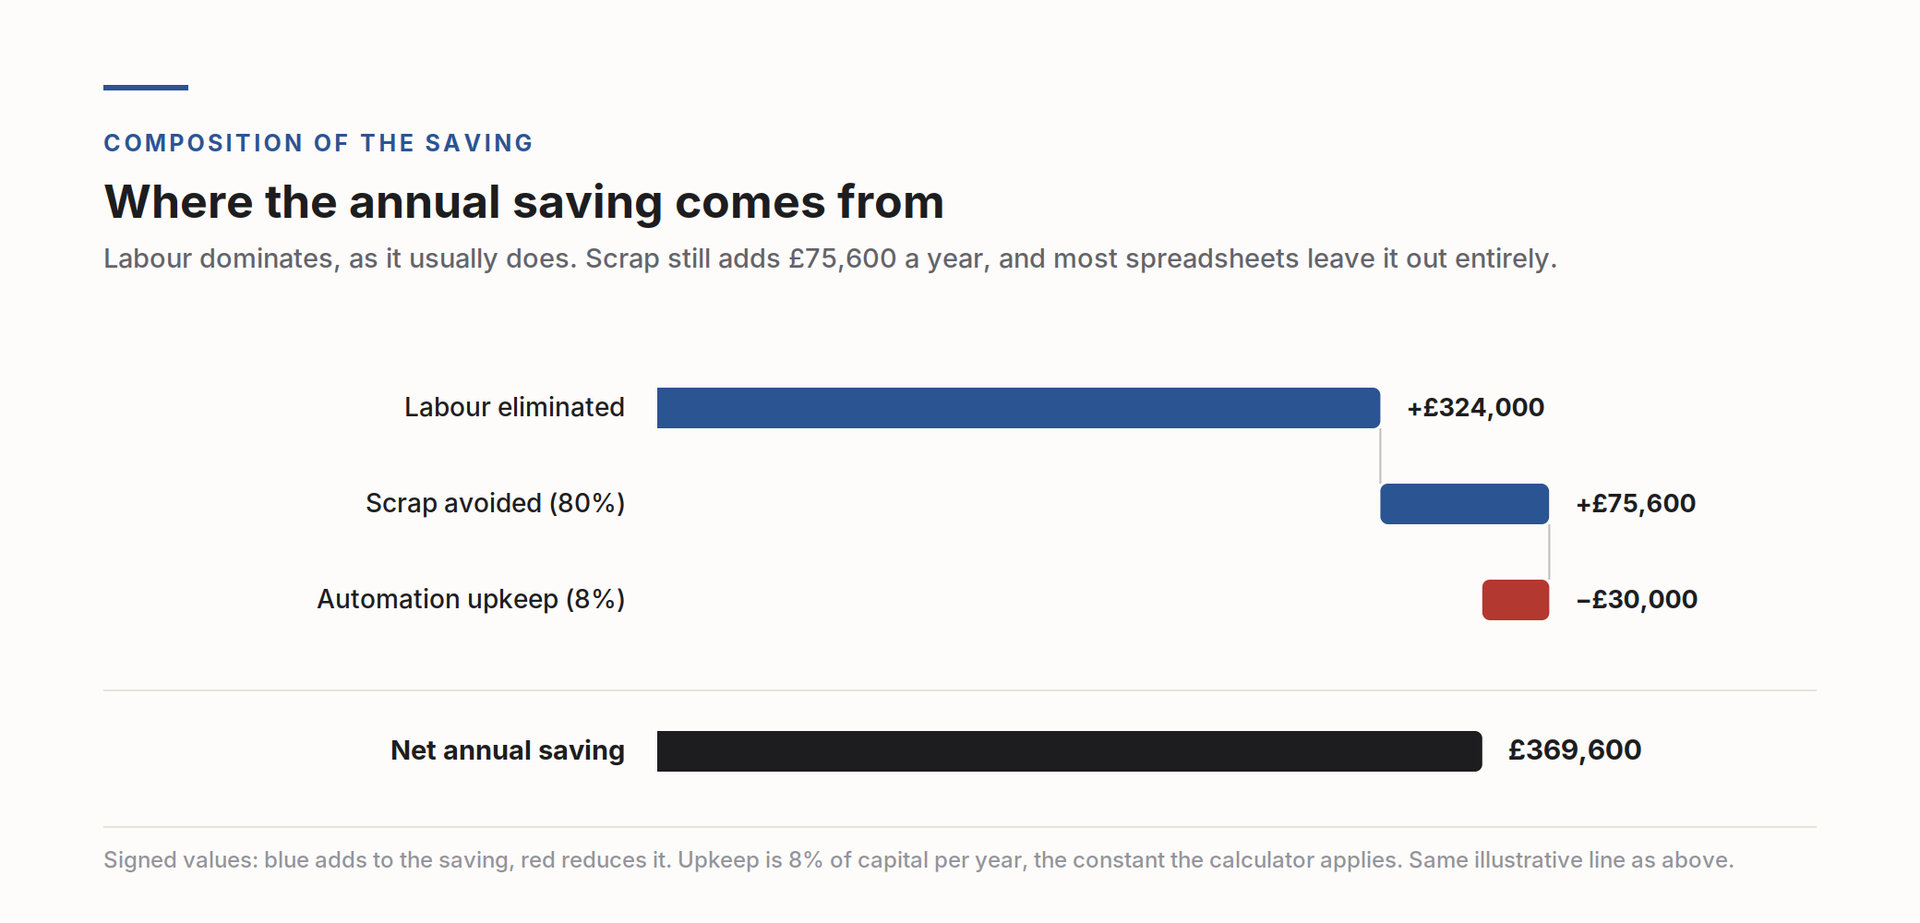
Take an illustrative line we ran while testing the model: three operators, two shifts, eight hours, a fully loaded rate of £27, 250 operating days, a 3% defect rate on 750,000 parts at £4.20 each. Current spend comes out at £418,500 a year, and the five-year cost of carrying on unchanged at £2.09m. The capital band for that job is £250,000 to £500,000. The capital number is the one that gets scrutinised at board level. It's the smaller of the two.
That comparison is the whole point of the tool. A payback period on its own tells you when you break even against a purchase. The two curves tell you what the delay costs, which is the question actually in front of you.
The figures that get left out
Three inputs account for most of the gap between a spreadsheet payback and a real one.
The rate, fully loaded
The calculator asks for the fully loaded hourly rate, meaning wage plus employer NI, pension and holiday, and it puts a typical UK manufacturing range on the field so you can sanity check what you have entered. Use the bare wage instead and every figure downstream of it is understated, because labour is the largest single term in the model.
Scrap, entered the way you already measure it
Scrap belongs in the labour argument, not in a separate paragraph at the end, because a repeatable machine and a tired operator on hour seven of a night shift do not produce the same defect rate. The trouble is that plants hold this number in two forms. Some know their defect percentage; others know what the skip costs them per day and have never converted it. Asking for the wrong one produces a guess or an abandoned form, so the calculator takes either.
Volume and part cost
A 3% defect rate means nothing until it is multiplied by what a part costs to make and how many you make a year. Those two fields are what turn a quality percentage into money, and they are why a modest-looking defect rate on a high-volume line is worth real money once automation removes most of it.
Why we ask for a band, not a number
Capital cost is entered as one of five ranges rather than a figure. That is deliberate.
Nobody knows the capital cost of a cell that has not been scoped. Asking for a precise number invites an invented one, and an invented number carried through to a two-decimal-place payback reads as authority it has not earned. So the model takes the midpoint of the band you pick, shows you that it has done so, and then puts the assumption under load: one of the five sensitivity cases in the report runs capital at 20% over budget. On the illustrative line above that moves payback from twelve months to fifteen, and the five-year return from 393% to 304%.
That is the useful output. Not a number, but how far the number moves when the thing you were least sure about turns out worse than you hoped.
Where the model stops
This is a screening tool. It is built to answer one question, which is whether a line is worth looking at properly, and it doesn't pretend to answer any other.
It does not know your cycle time, your changeover frequency, how your parts present themselves, what guarding the cell needs under ISO 12100, or whether the tooling to hold your part exists yet. Any one of those can move a capital estimate by six figures. It also cannot tell you whether the automated solution it is implicitly costing is the right one, because it has not seen your line.
What it does tell you is how robust the answer is. The report runs the base case alongside four stress cases: capital over budget, a lower labour rate than you stated, a smaller improvement in scrap, and one where you keep an operator on the cell for loading and oversight instead of removing the role. On the illustrative line the five results span twelve to seventeen months.
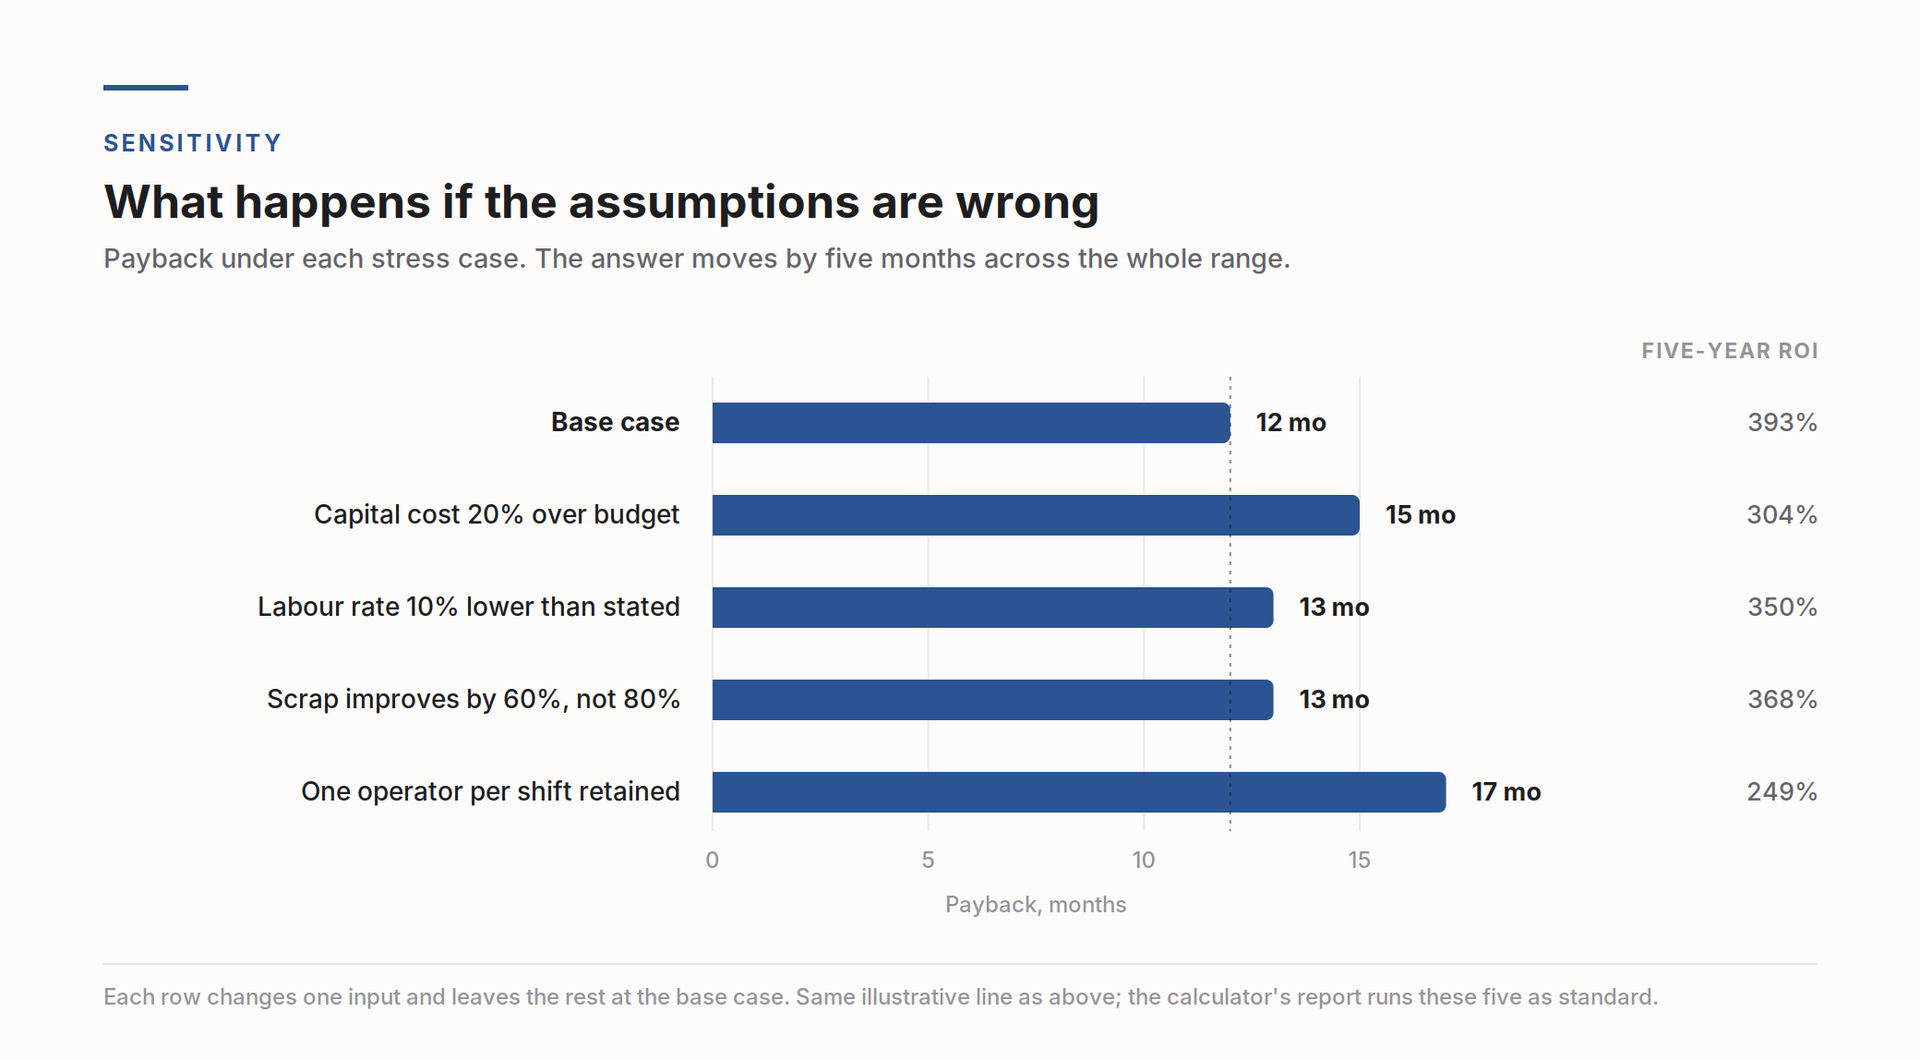
A result that stays inside a couple of years across all five is a case worth a site visit. A result that only works in the base case is not a no, but it isn't something the model can settle either. That takes an engineer on site with a stopwatch.
The report also names the assumption the return leans on hardest, which on most manual lines is labour, and shows what happens if that assumption is wrong rather than leaving it implied. It carries the year-by-year breakdown and every formula with your own values substituted, so any figure in it can be reproduced by hand. One email, no mailing list. We wrote it to be sent to a finance director without a covering explanation.
Using it
The calculator is at roi.jp-engineers.com. Enter the figures for one manual line, the one that already annoys you, and read the current spend before you look at anything else.
If the number surprises you, that is the finding. Everything after it is arithmetic.